
💳Investigating the efficiency of loyalty program💻
data: customers’ transactions data
techniques: ETL pipeline for SQL / pandas, pearson correlation
Analyzing customer transactions is crucial for every business. How often they shop? What’s their average spending? Does enrollment in a loyalty program influence their spending habits? These are some of the questions I attempted to answer here.
Creating the ETL pipeline
First, my goal was to write a script that extracts the data from the provided CSV files and uploads it to a local database.
Data
Data consists of two .csv files, customers.csv and transactions.csv which I uploaded into a local database using SQLite, joined and performed basic aggregation to fill in missing colums.
customers.csv: The customer CSV file provides a list of customer data, where each row represents a unique customer. Each column represents an attribute or value associated with the customer. The columns include:
-
id: unique user identification number -
date: date the user signed up for the service -
loyalty: Whether the user is enrolled in the program (enrolled) or part of the control group (control) -
location: Location attribute -
age: Age attribute -
favorite_movie_line: Favorite movie line of all time -
number_of_purchases: Total number of purchases -
value_of_purchases: Total value of purchases (in cents) -
total_standard_points: Total standard points earned from purchases (if enrolled in loyalty) -
total_points_redeemed: Total points redeemed for purchase discount
transactions.csv: The transaction CSV file provides a list of all transactions completed over a 2 year time period. Each column represents an attribute or value associated with a transaction.
date: date the transaction was completeduser_id: The id of the user that completed the transactionvalue: The value of the transaction (in cents)point_differential: The difference between points earned and points redeemed (i.e. pointsdifferential = standardpointsearned - pointsredeemed)
Creating the database
I created a local database with the following commands:
try:
    # Open the connection
    conn = sqlite3.connect('customers_transactions.db')
    # Write the customers and transactions data frames to a local database
    transactions.to_sql("Transactions", conn, flavor='sqlite',index=False)
    customers.to_sql("Customers", conn, flavor='sqlite',index=False)
    # Close the connection
    conn.close()

except ValueError:
    print 'Database already in the current directory, move on.'
If the database already exists, it will raise an error and move on.
Join & Aggregate
With the data loaded into my database, I wrote a script that extracts the data from local database and fills in the missing values in the following columns:
number_of_purchases
value_of_purchases
total_standard_points
total_points_redeemed
With the following SQLite query:
# Open the connection
conn = sqlite3.connect('customers_transactions.db')
a = conn.cursor()

# Write the SQLite query executed in the next step
sql_query = "SELECT user_id, loyalty, signup_date, location,\
            gender, age, favorite_movie_line,\
            count(user_id) as number_of_purchases,\
            sum(value) as value_of_purchases,\
            CASE loyalty\
                WHEN 'control' THEN\
                    0\
                ELSE\
                    sum(round((value/100)*100)/10)\
                END total_standard_points,\
            CASE loyalty\
                WHEN 'control' THEN\
                    0\
                ELSE\
                    sum(round((round((Transactions.value/100)*100)/10 - \
            Transactions.point_differential)/1000)*1000)\
                END total_points_redeemed\
            FROM Transactions JOIN Customers on user_id = id\
            GROUP BY user_id ORDER BY user_id"

df = pd.read_sql_query(sql_query, conn)

# Save (commit) the changes
conn.commit()

# Close the connection
conn.close()
In the .pynb file you will find an alternative analysis using pandas package. The advantage of using the SQL database is that it runs much faster.
Insights about the loyalty program
Next, my goal was to investigate the efficacy of the loyalty program. I grouped the conclusions of my analysis into executive summary below:
- Customers who are in the loyaty program tend to spend on average more money every time they shop (t = 4.85, p < 0.001) and they also shop more often. However, the loyalty program also costs money - with every applied discount the company spends 500 cents. It seems reasonable to take that into account and adjust the calculations.
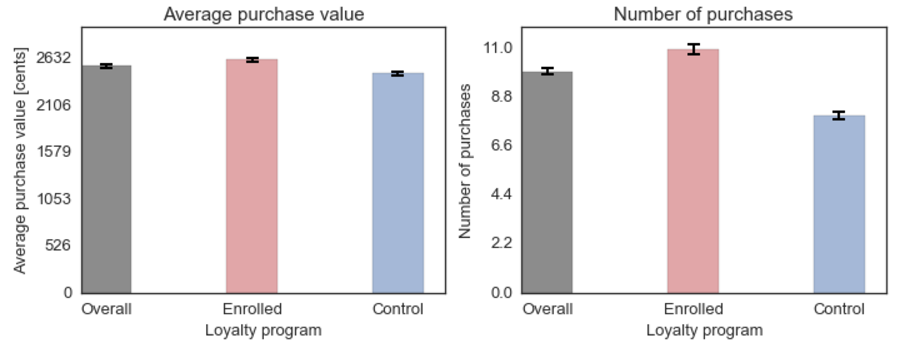
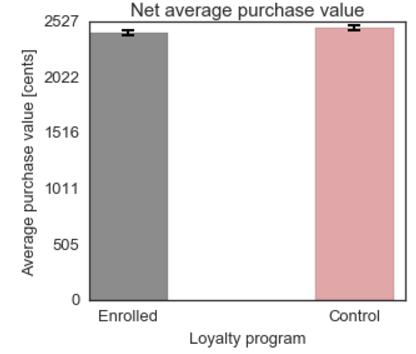
- After adjusting for the cost of the discounts redeemed by the customers the difference in the average purchase value is no longer significant, t = -1.67, p > 0.05. If I had more time, I would look at the number of purchases - it is possible that since enrolled customers on average shop more often the total net revenue might still be higher.
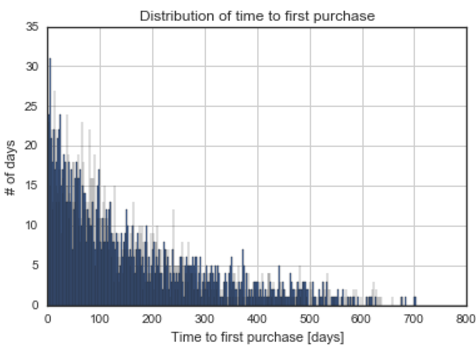
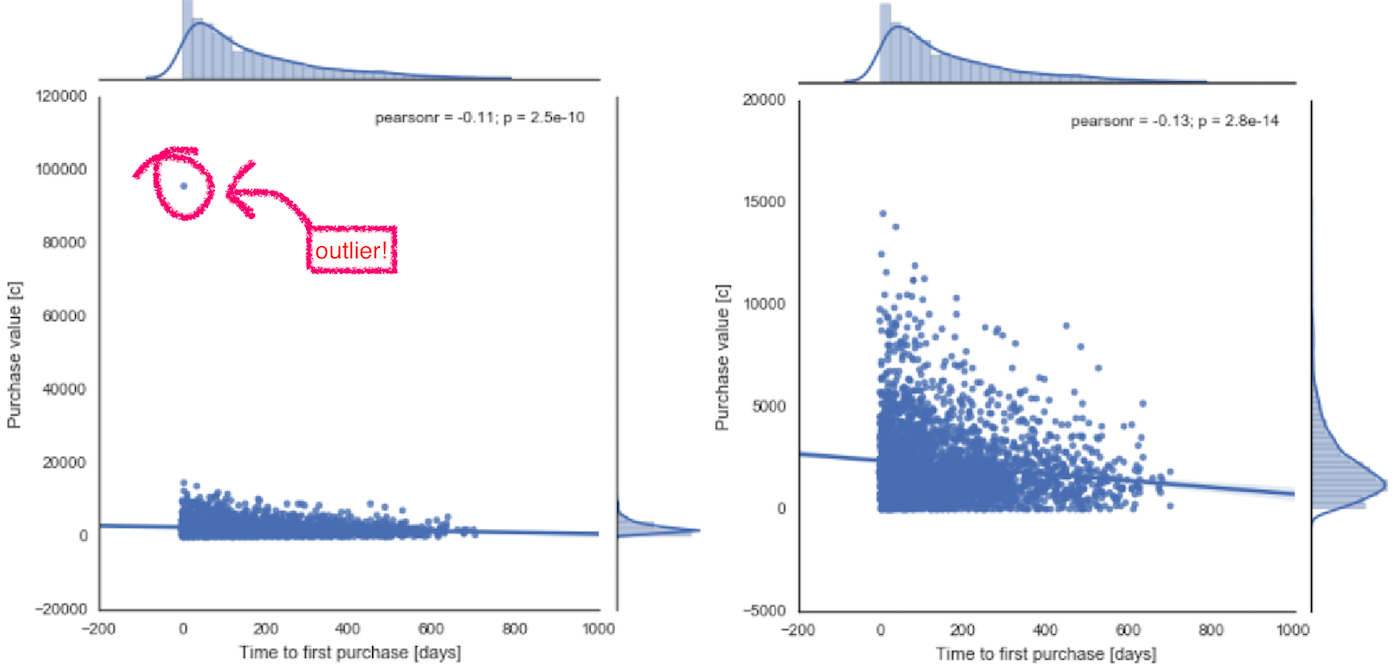
- Most customers make their first purchase shortly after signing up for the loyalty program. Enrolled customers tend to spend more money on the purchase soon after becoming members, as indicated by a negative correlation r = -0.13, p < 0.001. The correlation is weak, but highly significant. This relationship gains in significance after excluding one outlier who made a purchase of a value highly exceeding other customers. In this case, I considered it justified to remove them from further analysis.
Testing
To test the code to make sure it works run the following command in your terminal shell from the /Loyalty-Program-ETL/codedirectory:
python -m unittest test_utilities
You will then see a report on the testing results.
Requirements:
To install all of them (except Python) using pip run:
pip install -r requirements.txt