
🗺️Geospatial analysis of donations💸
data: transaction data
techniques: GeoPandas, normalization, big data
The following work was completed during one day at Giving Tuesday DataKind Dive, sponsored by Melinda and Bill Gates Foundation and 92Y.
Transaction-level data can give us consumer insights into giving patterns and giving motivations. It can provide insights to organizations seeking funds and help create measures of giving - such as an increase in amount or people giving by day or by year.
I dove into hundreds of thousands of donation transaction records provided by big companies such as Paypal and combined them with US census data (freely available) and ZIP code shapefiles (geospatial representation of ZIP codes) to create an interactive map of individual donors who contributed less than $200. The purpose of the data dive was to encourage small-time donors, and after looking at the distribution of donation values this seemed like a reasonable cut-off.
When analyzing individual donations in the context of the whole country it is important to look at the normalized values - adjusted by the median income in the area. This way by visual inspection of the map it is possible to identify the areas which are more likely to donate significant portions of their income.
This is why I in the analysis below I used the following normalization method:

purpose: provide a map of small donors normalized by the income to direct marketing campaign more efficiently, especially outside of big cities.
data: I used a subset of transactions data narrowed down to 2016 by executing in the Terminal:
cat donations_post_gt.csv | grep 2016 >> donations_post_gt_2016.csv
tools: numpy, pandas, matplotlib, GeoPandas
code: on my github
Deliverable is the code and the following interactive map, which can be accessed here on my Carto profile.
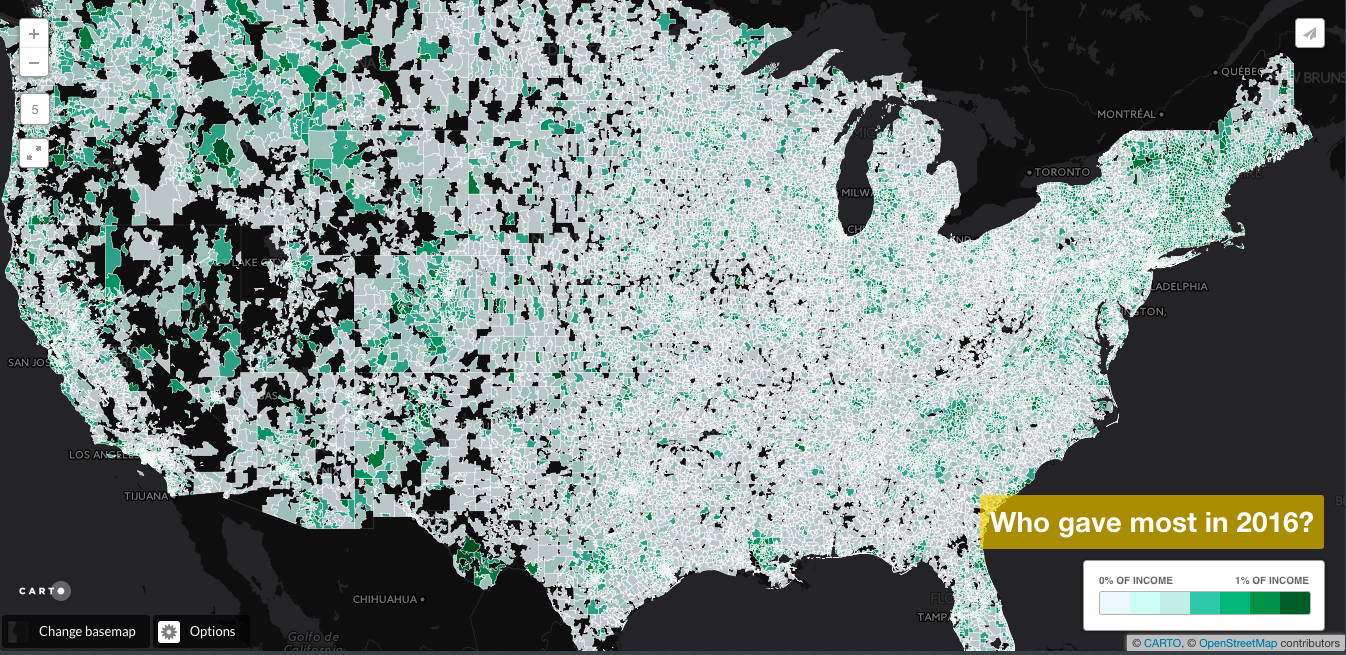
#Insights: Interestingly, when we look at adjusted donation amounts we see that big cities no longer dominate the giving drive. For example, there are ZIP codes areas in south Texas, Utah, Montana and Idaho which donate as much or more than urbanized centers on the West and East Coast. By hovering over the map we can inspect specific zip codes, the number of households within the area and the total amount of donations.